Recent trends in dairy farm productivity1
By
Ann Anderson and Robin Johnson2
Dexcel Corporation have recently commissioned an investigation into dairy farm productivity among owner operators and 50/50 sharemilkers. This paper reports on the results and some implications for national dairy farming policy. Data is drawn from the Economic Survey of Factory Supply Dairyfarmers and productivity measures are based on moving average weighted index numbers. There has been a steady growth in productivity in both samples since 1994; total input productivity increased by 2.4% per annum for owner operators and 4.7% per annum for 50/50 sharemilkers. The results have policy implications for the growth targets for the industry set in the McKinsey report on the dairy industry.
Introduction
The McKinsey Report on the dairy industry noted the low rate of productivity growth in the farm sector and that the movement had been negative in some seasons. The Report sets an objective for productivity growth of 4% per year over the whole industry. Such an objective could only be obtained by growth in output without a corresponding growth in resources used. In periods of heavy investment in purchased inputs and capital improvements productivity improvements could be delayed for some years.
In this paper trends in productivity growth in the farm sector are analysed. The methodology employed will be described first followed by a summary of the main results. The statistical analysis is discussed in the technical appendix.
Measuring Productivity
Productivity measures are sought for the owner operator sector of the dairy industry and the 50/50 sharemilker sector. The data is drawn from the Economic Survey of New Zealand Dairy Farmers (Dexcel Limited 2001).
The aim of productivity measures is to isolate changes in physical efficiency in production. Essentially this involves deriving consistent measures of production on the one hand, and the accompanying real resources that are used in the process of production, on the other.
Productivity is measured at the whole farm level. Total output is all that a farm produces, and input covers all resources that are used on the farm, viz. purchased inputs, labour employed or assessed, and land resources.
Physical productivity measures require all survey data to be converted to its physical equivalent. Survey data is normally recorded in current prices hence the effect of inflation is incorporated in the data. This has to be removed by deflating the survey data by price indexes related to the individual categories of products produced and inputs used. In this report, price indexes from Statistics New Zealand and Quotable Value New Zealand are utilised.
All production data and input data is converted to a set of index numbers. Weighting systems have to be employed where a group of products (with different prices) make up total production and where a group of inputs (with different prices) make up total inputs. The weighting system used in this analysis is a chain linked index number methodology named after a statistician called Tornqvist. Details are shown in the technical appendix.
To apply this methodology, the weights for each input and product category are derived according to actual cost or value. The weights are the value shares that each input or output bears to its total value. In the case of the input of labour and capital, it is assumed that all wages and wages of management (as assessed in the production survey) are paid and any residual income is identified as the going reward for the capital investment involved.
It is argued that dairy farmers carry out their activity for the labour reward and accept a very low real return on capital employed. In the case of 50/50 sharemilkers, the return on capital (exclusive of capital appreciation) is negative in most years after allowing for the full cost of their labour.
Definitions
Total outputis the sum of all products shown in the farm surveys. Each product category is deflated by its relevant price index to determine real total output, i.e. total output at constant prices. To form an index of total output produced, the real changes of the components of total revenue (i.e. milk sales, livestock sales etc) are brought back together and weighted in accordance with their share of total revenue.
Total inputis the sum of all purchased inputs (excluding wages) and the estimated total cost of labour and capital assets. It excludes depreciation and interest paid. Each input category is deflated by its own price index except labour use and capital cost. Labour use is measured by total labour units as determined by Dexcel and capital use is measured by the deflated value of the farm assets. Land and buildings are deflated by the average price of dairy farm land as estimated by Quotable Value New Zealand. Livestock capital and farm equipment are deflated by appropriate index numbers from Statistics New Zealand. The index of total input use is derived by bringing all the components together and weighted in accordance their share of total cost.
Total productivity (TP) is the ratio of weighted total output to weighted total input.
Factor shares are the proportions in value terms that individual outputs and inputs relate to total values. These are the basic weights in the index number formulas.
The index number formula is given in the appendix to this paper.
Results
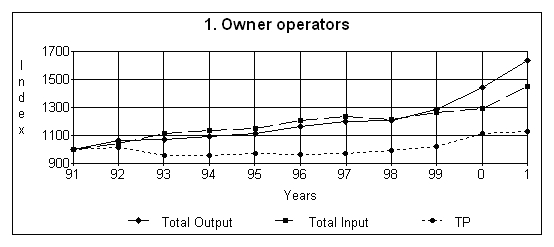
Chart 1 shows the key results for the owner-operator sample. Table 1 shows the broad trends broken down into annual percentage changes. At the foot of the columns are the average growth rates of change. Average annual growth rate formulas are discussed in the technical appendix.
| Table 1: Indexes for Owner Operators | |||
|---|---|---|---|
| (percentage change) | |||
| Season | Total Output | Total Input | Total Productivity |
| 90-91 | - | - | - |
| 91-92 | +6.2 | +4.7 | +1.5 |
| 92-93 | +0.7 | +6.3 | -5.4 |
| 93-94 | +2.3 | +2.3 | +0 |
| 94-95 | +2.1 | +1.1 | +0.9 |
| 95-96 | +4.4 | +4.8 | -0.2 |
| 96-97 | +3.2 | +2.6 | +0.5 |
| 97-98 | +0.6 | -1.7 | +2.4 |
| 98-99 | +6.4 | +3.9 | +2.4 |
| 99-00 | +12.2 | +2.2 | +9.7 |
| 00-01 | +13.6 | +12.4 | +1.2 |
| Average % Growth rate | +4.1 | +3.0 | +1.1 |
The 1990s were characterised by a steady growth in output with a spurt toward the end of the decade. In the early years, the use of resources increased faster than output and depressed productivity growth. Average farm size and herd size were both expanding through the decade. Some of the later growth in output is due to earlier investment by the farmers.
Over the period analysed, productivity has increased by 1.1% per year on average for owner operators. There is marked variation between years. In some years, the productivity trend is determined by changes in production and in others by changes in the use of inputs (costs). Since 1994, the rate of growth has been 2.4% per year.
In the seasons 1992-93 and 1997-98, production of milk was static due to seasonal conditions. In the seasons 1991-92, 1992-93 and 1995-96 there were substantial increases in costs due to increased supplementary feeding, fertiliser use, and animal health expenses. As a result, the rate of increase of real costs exceeded the rate of increase of production and productivity fell sharply or increased by only a small amount.
Chart 2 shows the overall trends for the 50/50 sharemilker sample. Table 2 shows the key results expressed as annual percentage changes.
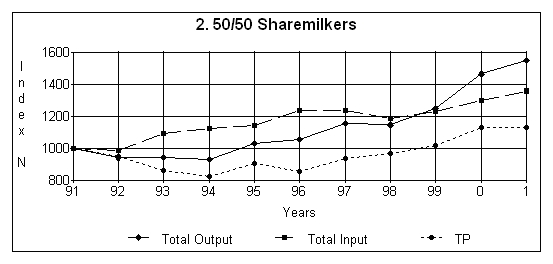
On 50/50 sharemilker farms, the growth in production has been greater than in owner operator farms. But like owner operators, the early 1990s saw greater growth in the use of resources than in output. As a result, the productivity measures fell in the early 1990s but then started to rise quite rapidly from 1995-96.
The average rate of change in total productivity has been considerably higher in the sharemilker sample. However, the response to seasonal conditions is different in the two samples. Lower livestock sales caused a drop in weighted output in the 50/50 sharemilkers in 1991-92 and 1993-94. Increased feeding costs caused an increase in total input in 1992-93 and 1995-96 particularly. As a result the changes in TP in the 50/50 sharemilkers sample from year to year are more extreme. Since 1994 the rate of growth has been 4.7% per year.
| Table 2: Indexes for 50/50 Sharemilkers | |||
|---|---|---|---|
| (percentage change) | |||
| Season | Output | Input | TP |
| 90-91 | - | - | - |
| 91-92 | -6.1 | -1.2 | -5.0 |
| 92-93 | +0.3 | +10.6 | -9.3 |
| 93-94 | -1.3 | +3.0 | -4.2 |
| 94-95 | +10.6 | +1.2 | +9.3 |
| 95-96 | +2.7 | +8.6 | -5.4 |
| 96-97 | +9.4 | -0.2 | +9.3 |
| 97-98 | -1.0 | -4.2 | +3.4 |
| 98-99 | +9.2 | +3.6 | +5.3 |
| 99-00 | +17.0 | +5.7 | +10.7 |
| 00-01 | +5.6 | +4.6 | +0.4 |
| Average % Growth rate | +4.8 | +2.9 | +2.0 |
The two samples differ in structure in their cost patterns and capital employed. Fertiliser cost is much lower for sharemilkers and hence influences the result less. The capital employed by sharemilkers is also much lower (land and buildings not being their responsibility) hence changes in this element do not influence their result as much. Labour costs are about the same as Dexcel estimates them the same way. But since sharemilkers wages are a higher proportion of the value of production, changes in labour use have more influence on the productivity estimates. Changes in capital employed have a relatively low weight in both samples.
Comparison with other studies
It is of some interest to compare the dairy results with other types of farming. Forbes and Johnson (2000) show that the national average growth in total productivity on farms was 1.8% per annum in the period 1985-98. Table 3 shows the result of a study by Philpott (1994) comparing total factor productivity in dairy with sheep farming and horticulture. Philpott uses national estimates of factor income, factor inputs, labour employed and capital employed and weights all inputs by their average factor share value. The corresponding estimates from this analysis are given at the foot of the table.
In the period 1983-93 the horticulture sector was going through an expansion phase and contributed the most to national total factor productivity growth. Sheep farming and dairy farming were much lower in productivity growth. Sheep farming was declining in importance in this period; dairy farming was on a moderate expansion path.
| Table 3. Dairy farm total factor productivity and type of farming (growth rates) 1983-93 | |||
|---|---|---|---|
| Factor Input | Factor Output | TFP | |
| (% per year) | |||
| Sheep | - 1.7 | - 0.8 | 0.8 |
| Dairy | 1.4 | 1.8 | 0.5 |
| Horticulture | 4.6 | 9.5 | 4.7 |
| ALL FARMS | 0.1 | 2.1 | 2.1 |
| (Source: Philpott 1994) | |||
| Note: These rates of growth are rounded. | |||
Discussion
On the output side, milk income is the dominant product category. Livestock sales as a source of income tends to be rather erratic in the survey results. For further farm management analysis, therefore, total output of milk solids will continue to be a good proxy for total production or output.
On the input side, the driving force is purchased inputs. Factor inputs are relatively static. The down-turn in productivity in the early 1990s was due to increased use of pasture and supplements and fertiliser in the owner operator sample. (Pasture and supplements includes hay, silage, meal, cropping, pasture renovation, grazing and contractor costs). In the 50/50 sharemilker sample, there was increased spending on animal health, pasture and supplements and fertiliser.
It will always be possible for a reversal in the productivity trend when the growing seasons are poor or drought spreads across the main dairy producing regions.
There is some evidence from other studies that farm investment takes a period of time to bed down before productivity results are apparent ( Forbes and Johnson 2000). In the production survey, most of this capital expenditure is not shown directly as the input records are based on farm accounts. However, it is clear in a season like 2000-01, when payouts reached record levels, that farmers were spending their increased revenue on capital improvements like increased fertiliser applications, which will benefit production levels in following years.
The dairy farm sector is recorded in other surveys as achieving lower productivity growth that the sheep and horticulture sectors in the 1980s (Philpott 1994). The above results suggest expanding production is accompanied by productivity gains and that the maintenance of investment in the industry has been a problem over a considerable period in the past. It is thus clear from the results of this analysis that a greater focus on increased production techniques and performance will be required to meet the McKinsey growth objective in the dairy farm industry in the future.
Technical Appendix
1. Terminological differences
In a number of reports total productivity is referred to as total factor productivity (ABARE 2001; Forbes and Johnson 2000). In strict terms, total factor productivity relates to the ratio of value added to factor inputs alone. In this paper, productivity relates to a whole farm approach as does the ABARE report on the Australian dairy industry and is called total productivity throughout.
2. Index numbers
To overcome the base year bias problem in volume indexes (and price indexes), the Tornqvist discrete approximation to a Divisia Index is utilised. This defines the output index, O t, as the weighted change in the proportions of its base weighted and current weighted components:
| (1) | Ot = Σ i(Oti/Ooi)1/2 (wti + woi) |
| where wti = the share of the ith output(jth input) in total nominal output (input) in year t, and | |
| woi = the share of the ith output (jth input) in total nominal output (input) in the base year. |
This can be transformed by logarithms to the base e to give the estimation formula:
| (2) | ln O t = Σ i 1/2 ( wti + woi ) ( ln Oti - ln Ooi) |
By taking anti-logs, the base year takes on a value of unity. The resulting index numbers now represent a moving weighted geometric average of base year output quantities and the current output quantities.
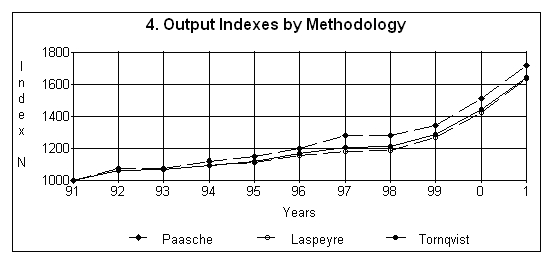
For comparative purposes, index numbers for total input and total output are also estimated on a base set of weights and a current set of weights.
(i) Base year weighting: relative importance of components to some chosen base year, o:
| (3) | O*t = Σi ( Woi Oti ) / Σi (Woi Ooi ), i outputs; (Laspeyre index) |
| Woi= weight in year o for i th output. |
This reads as current level of output at base year weights compared with base year output at base year weights.
(ii) Current year weighting: weights reflecting current importance, base year quantities
| (4) | O** t = Σi (Wti Ooi) / Σi (Wti Ooi ); (Paasche index) |
| W ti = weight in year t for i th output. | |
This reads as current level of output at current weights compared with base year output at current weights.
The Fisher Ideal Index is the geometric average of the Laspeyre and Paasche indexes. The Tornqvist index gives a close approximation to the Fisher Ideal Index. As milk income dominates dairy farm output, the different index number methodologies give fairly similar results.
3. Growth Formula
Change in productivity and its components can be shown as annual percentage changes, average percentage change over a period, and by means of charts. The average percentage change formula is:
| (5) | ln Ot = a + bT |
| where | Ot = weighted index number of output etc |
| a = a constant | |
| b = regression coefficient, and | |
| T = years |
If the estimated regression coefficient is 1.033, this reads as ln Ot increases by a multiplicand of 1.033 per year, or 3.3% additional per year. By measurement in logarithms, the same percentage change applies to every year.
4. Measuring the stock of ‘Capital’
In productivity analysis, Capital represents the fixed assets used in the production process. Economists like to distinguish between capital goods which last over a period of years and current goods that are used up in the short term production process. This convention invades all accountancy terms of measurement and leads to the concept of depreciation as a justifiable tax allowance. Thus in accountancy asset values are distinguished from ‘cash expenses’.
So when economists want to measure productivity they need to have a measure of ‘capital’. Conceptually, capital should measure the volume of lasting goods which contribute to ongoing production. The way to measure this is to work out how much has been spent on such capital goods at any given time and then estimate by how much it has lost effectiveness through wastage. Such wastage could be called true depreciation (to be distinguished from tax-allowed depreciation). The data needed to measure such a physical inventory of goods consists of all past spending on such capital goods and some idea of the rate at which they waste or decay. The best way of measuring this is to have periodic inventories carried out and to ascertain what has gone missing.
Market values of assets on a balance sheet do not meet these requirements. Market values measure what valuers think the assets are worth in the market place. This in turn depends on what owners or potential purchasers think such assets can produce in the future. In this study, market value is deflated by an index of land (and buildings) prices estimated by Quotable Value New Zealand. Equipment and livestock values in the balance sheets were deflated by Statistics New Zealand indexes of the prices of the relevant goods for dairy farms.
Owner operators have a large proportion of their capital locked up in land and buildings. Sharemilkers, on the other hand, have no land capital but relatively high investment in equipment and their herds.
5. Livestock sales
The survey accounts treat livestock sales as a ‘net’ sales figure, by deducting annual purchases of replacement stock. In the 50/50 sharemilkers sample purchases exceed sales in some years. In this case the total output and total input variables have to be redefined on a ‘gross’ basis. This makes a difference to the productivity estimation for the years concerned but does not affect the analysis presented here for the years 1990-2001.
References
ABARE (Australian Bureau of Agricultural and Resource Economics)(2001), Productivity in the Australian Dairy Industry, 1978-79 to 1998-99, Report for Dairy Research and Development Corporation, Canberra, May.
Dexcel (2001), Economic Survey of New Zealand Dairy Farmers, Dexcel Limited, Hamilton, New Zealand.
Forbes R; Johnson R W M (2000) 'Recent Trends in New Zealand Agricultural Productivity and its Measurement', Paper presented at the 44th Annual Conference of Australian Agricultural and Resource Economics Society, Sydney, January 2000.
Philpott. B.P. (1994), Productivity Growth by Type of Farming 1972-93, RPEP Paper 259, Research Project on Economic Planning, Victoria University, Wellington, New Zealand.